15 June 2026

Recent Rainfall Accumulation For UK Climbing Conditions
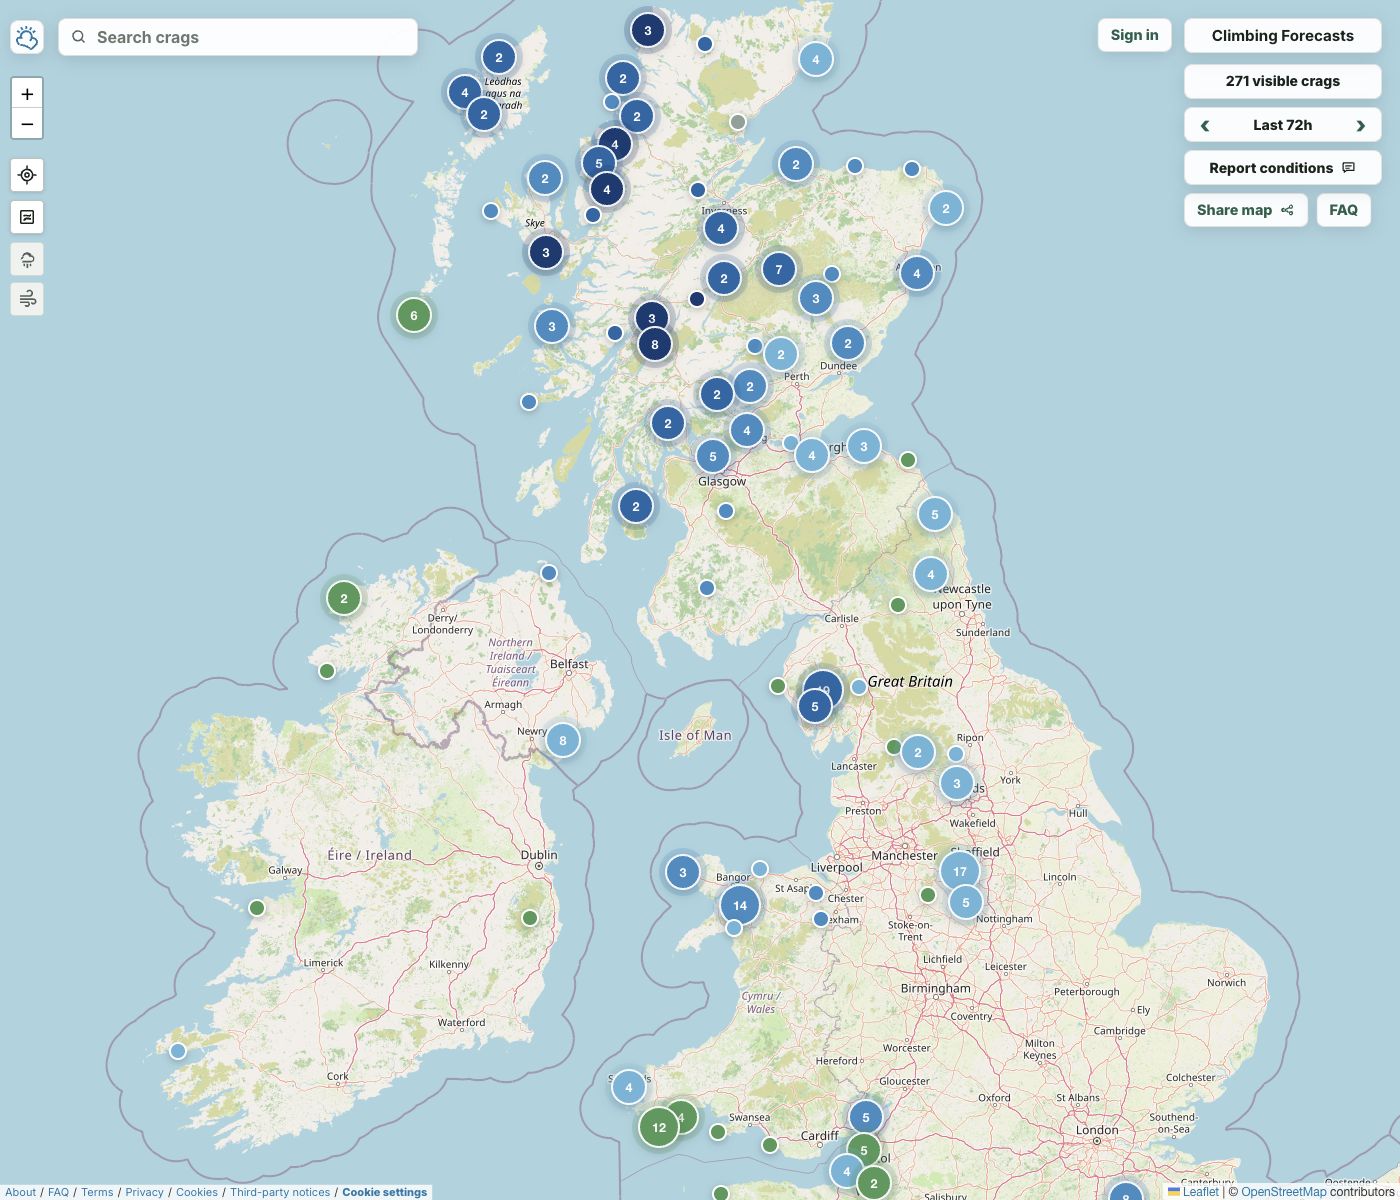
Climbing Forecasts now shows recent rainfall accumulation on the main map, giving climbers a quick way to compare observed rainfall around UK crags.
Step back from today's climbing-condition view and the map switches to rainfall observed yesterday, over the last 72 hours, and over the last 7 days.
The useful part is comparison. A dry forecast can look similar across a region, but the recent rainfall history behind each crag may be very different. The accumulation view makes those differences visible without opening individual crag forecasts one by one.
What The Map Shows
The rainfall views are based on radar-derived rainfall samples around crag locations.
The markers use a separate colour scale from the normal climbing-condition markers:
- Green: little or no meaningful recent rain
- Progressively darker blues: higher rainfall accumulation
- Grey: missing or insufficient radar coverage
The aim is not to turn rainfall into a single answer. It is to show recent observed rainfall quickly enough that it can be used alongside the normal forecast, local knowledge, and recent condition reports.
Why It Is Useful
Forecasts and observations answer different questions.
A forecast shows what is likely to happen next. Rainfall accumulation shows what has already happened around the crag.
That distinction is useful when nearby areas have had different weather. A 72-hour accumulation view can make it obvious that one part of a region has stayed relatively dry while another has taken repeated showers. The 7-day view gives a wider recent-history check, which is often the more relevant signal for slow-drying or seepage-prone venues.
Climbing Forecasts already uses recent rain radar as one input in its condition analysis. This map view exposes part of that recent-rain picture directly, so the broad pattern is easier to inspect.
For more background on the radar source and why it is useful for crag-level analysis, see Why Climbing Forecasts Uses Rain Radar.
A First Look At The Current Data
This feature is new, so the data history is still short. As of 15 June 2026, the radar sample archive used by Climbing Forecasts runs from 19 May 2026 to 15 June 2026. That is enough for recent-rain context, but not enough for seasonal conclusions or long-term rainfall rankings.
The last 7 days already showed the kind of contrast this view is designed for. Some mountain and western crags had received large accumulations, while several coastal and southwest venues had much lower totals.
Examples from the 7-day accumulation view on 15 June 2026 included:
- Ben Nevis Summit Buttresses: about 103 mm
- Black Crag, Borrowdale: about 88 mm
- Castle Rock of Triermain: about 86 mm
- Beinn Trilleachan, Etive Slabs: about 80 mm
- Hound Tor: about 2 mm
- Land's End: about 2 mm
- Haytor: about 3 mm
- Chair Ladder: about 3 mm
Those numbers are a snapshot, not a ranking. Their value is in the contrast: a quick way to see where recent rain has been concentrated and where it has not.
What Grey Markers Mean
Grey means the accumulation view does not have enough usable radar coverage for that crag and time window.
That can happen because of radar coverage limits, missing frames, or gaps in the sampled data. Rather than showing a misleading rainfall total, Climbing Forecasts marks those cases as missing.
Zero rain and missing data are deliberately kept separate. Green means little or no meaningful observed rain. Grey means the system is not confident enough to show a rainfall amount.
What This Data Can And Cannot Say Yet
The current data is useful for recent decisions and area comparison. It can help answer questions such as:
- Which nearby areas have had meaningful rain in the last few days?
- Has this crag had a mostly dry 72 hours?
- Are mountain crags and coastal crags showing very different recent rainfall?
- Is the forecast dry, but recent rainfall still a reason to be cautious?
It cannot yet support broader claims such as:
- Which UK crags are normally the wettest?
- Which areas are best after a wet month?
- How rainfall accumulation varies by season.
- Which rock types recover fastest from observed rainfall.
Those questions need a much longer data record and careful validation. This first version is intentionally more immediate: show recent observed rainfall around the crags now.
How To Use It
Treat rainfall accumulation as context, not a verdict.
The useful comparisons are often between alternatives: a nearby coastal crag versus an inland crag, a valley venue versus a mountain crag, or one side of a region versus another. If the forecast looks similar but recent rainfall does not, that difference is worth knowing before committing to a plan.
The rainfall view is strongest when combined with the normal climbing forecast, recent conditions reports, and local judgement about the venue.
Early Data, Practical Signal
Observed rainfall accumulation is not a complete climbing-conditions model on its own. It is a direct view of one important input: where recent rain has actually fallen, and how much has accumulated around the crags.
As the archive grows, there will be more to analyse. For now, the value is practical and immediate: compare recent rainfall quickly, then use that signal alongside everything else you already know about the crag.